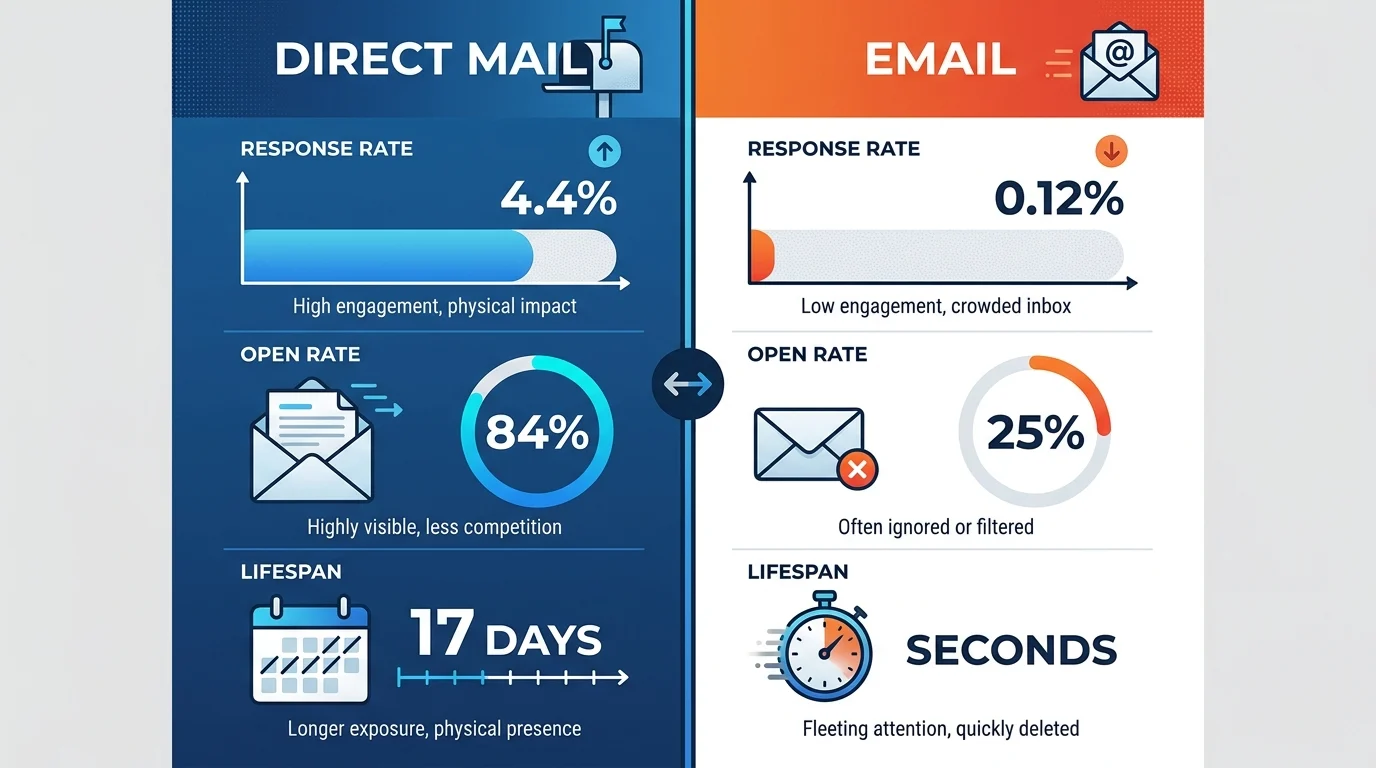
Quick Ans: Direct mail response rates average 4.4% overall, compared to just 0.12% for email – a 37x advantage . House lists (existing customers) pull 5-9% response rates, while cold prospect lists average 2-4.4% . The channel delivers 112-161% average ROI , with 84% of consumers reading or scanning all their mail and an average lifespan of 17 days in the home .
In an era where inboxes overflow and digital ads are instantly forgotten, direct mail is staging an extraordinary comeback. The numbers tell a compelling story: 4.4% average response rates vs. email’s 0.12%, 84% open rates vs. email’s 20-25%, and 17 days of physical presence vs. email’s fleeting seconds of attention . This isn’t nostalgia marketing – it’s data-driven performance.
Companies now dedicate 25% of their total marketing budgets to direct mail, with nine in ten leaders increasing investment year over year . The conversation has shifted decisively from “does it work?” to “how do we make it work better?” .
What’s driving this resurgence? Digital fatigue is real – over 42% of global internet users employ ad-blocking tools, and digital customer acquisition costs have skyrocketed 222% over the last decade . Direct mail offers something digital cannot: physical presence, tangible trust, and the undivided attention of recipients who spend an average of 141 seconds with each piece of mail . Understanding direct mail response rates is no longer a niche skill – it’s essential knowledge for modern marketers.
The Numbers That Matter: Average Response Rates
1. Overall Average: 4.4%
The ANA/DMA Response Rate Report puts the overall average response rate for direct mail at 4.4% across all list types .
2. House Lists Perform Significantly Better
Existing customer lists consistently deliver 5-9% response rates .
3. Cold Prospect Lists: 2-4.4%
Reaching new audiences yields 2-4.4% response rates, substantially outperforming digital alternatives .
4. Email’s Benchmark: 0.12%
Email marketing averages just 0.12% response rate – making direct mail roughly 36 times more responsive on a per-piece basis .
5. Opening/Reading Rate: 84%
In a striking contrast to email’s 20-25% open rates, 84% of consumers read or scan their direct mail .
6. Digital Engagement Follows
9.4% of mail items prompted a website visit in Q1 2026 – a record for the first quarter .
7. Lifespan: 17 Days Average
The average piece of direct mail remains in the home for 17 days, creating extended brand exposure .
8. Multiple Interactions
The average piece of direct mail is interacted with 4.5 times over a 28-day period .
9. Attention Span: 141 Seconds
Direct mail commands 141 seconds of attention across 28 days – far surpassing any digital alternative .
10. ROI: 112-161%
Direct mail delivers consistent ROI ranging from 112% to 161%, outpacing email’s 44% .
House Lists vs. Prospect Lists: The Response Rate Gap
1. House Lists: 5-9% Response
Existing customers are your best audience – they already know and trust your brand .
2. Cold Prospect Lists: 2-4.4% Response
New audiences require more effort to convert, but still deliver strong results .
3. Warm Direct Mail ROI: Up to £11.50 Per Piece
Targeting existing customers delivers the highest return on investment .
4. Cold Direct Mail ROI: £3.20 Per Piece
While lower, cold mail ROI still outperforms most digital channels .
5. Retention vs. Acquisition Impact
House list campaigns are among the highest-ROI uses of direct mail, making customer retention a strategic priority .
6. Data Quality Is the Deciding Factor
The difference between a 2% response rate and a 0.2% one is almost always list quality .
7. Targeting Decision-Makers Matters Most
For B2B campaigns, reaching people with budget authority has more impact on response rate than creative execution .
8. Intent Signals Boost Cold Response
Accounts actively researching your category are far more receptive to outreach .
9. House Lists Respond to Brand Building
Campaigns that combine brand and response objectives see response rates triple on average .
10. Volume and Repeat Sends Improve Performance
Larger cold mail sends enjoy higher ROI, while repeat sends improve all performance metrics .
Industry-Specific Response Rates
1. Luxury Goods / Services: 4.46%
The highest response rate across all industries .
2. Technology: 4.30%
Tech companies see strong returns from direct mail outreach .
3. Travel and Hospitality: 4.21%
Travel brands effectively convert through physical mail .
4. Healthcare and Pharma: 4.09%
Medical and pharmaceutical campaigns deliver solid results .
5. Financial Services: 3.95%
Financial institutions leverage direct mail for trust and compliance .
6. Automotive: 3.84%
Auto dealerships and manufacturers see reliable response .
7. Home Services: 3.75%
Contractors and service providers benefit from local targeting .
8. Nonprofits and Charities: 2.86%
While lower overall, charity warm lists can achieve 11.1% response rates .
9. Merchants Lead Response: 57% Read Rate
Merchants (especially catalogs) have the highest reading and response rates of any sender category .
10. Retail/Online Retail Cold: 0.9%
Retail cold mail averages 0.9% response, while warm retail mail reaches 3.6% .
Why Direct Mail Outperforms Digital
1. Physical Presence and Trust
70% of consumers feel direct mail is more personal than digital communication .
2. The Endowment Effect
Physical mail creates a sense of ownership that digital cannot replicate – it stays in the home, not in a spam folder .
3. Digital Fatigue Protection
42% of global internet users employ ad-blocking tools – direct mail bypasses these barriers entirely .
4. Longer Attention Window
The average email gets 17 seconds of attention; direct mail receives 141 seconds of engagement over 28 days .
5. Higher Open Rates
84% of consumers read or scan their mail vs. 20-25% email open rates .
6. Digital CAC: Up 222%
The skyrocketing cost of digital customer acquisition makes direct mail economically attractive .
7. Omnichannel Synergy
Clients receiving both email and physical mail spend 400% more than those receiving only email .
8. 56% of Mail-Driven Purchases Now Online
Mail increasingly drives digital behavior – a record since tracking began .
9. Enduring Shelf Life
The median lifespan of a direct mail piece is 23 days, giving brands persistent visibility .
10. Higher Conversion Value
Mail delivers 161% average ROI compared to email’s 44% .
The Omnichannel Effect: Digital Amplification of Direct Mail
1. Website Visits from Mail: 9.4%
In Q1 2026, 9.4% of mail items prompted a website visit – a record high .
2. Online Purchases: 56%
Over half of all purchases driven by mail were fulfilled online in Q1 2026 .
3. 67% Search After Receiving Mail
Two-thirds of consumers have visited a website or searched online after receiving a direct mail piece .
4. Cross-Channel Lifting
Direct mail and digital channels combined increase overall sales by 447% .
5. 68% Marketer Website Visits
When direct mail and digital are combined, 68% of marketers experience increased website visits .
6. 40% Conversion Rate
The combination delivers conversion rates of 40% .
7. 60% Increased ROI
Marketers report 60% higher ROI from integrated campaigns .
8. QR Codes Track Real-Time Response
QR codes, PURLs, and promo codes enable multi-angle campaign measurement .
9. Only 22% Track QR Codes Currently
There’s significant untapped opportunity for better visibility into campaign performance .
10. Identity Resolution Integration
Identity resolution and social media retargeting create seamless omnichannel experiences .
Key Factors That Boost Response Rates
1. List Quality Is Everything
Targeting the right people has more impact on response rate than creative execution .
2. Personalization Drives Engagement
64% of consumers are more likely to engage with personalized messaging .
3. 96% of Leaders Say Personalization Works
Almost all marketing leaders confirm that personalization improves results .
4. A Single Clear CTA
One clear call-to-action outperforms multiple competing CTAs .
5. Omnichannel Follow-Up
Email before, call after – each touchpoint compounds response likelihood .
6. Intent Signals
Reach accounts actively researching your category for maximum receptivity .
7. 72-Hour Processing Time
The response to direct mail peaks within 72 hours – timeliness matters .
8. Brand + Response Objectives Triple Response
Campaigns combining both objectives see response rates triple on average .
9. Volume and Frequency
Repeat sends improve all performance metrics .
10. AI for Personalization
High-ROI teams are 3x more likely to use AI for personalization, attribution, and delivery accuracy .
Challenges and Considerations for 2026
1. Logistics Blind Spots
87% of leaders cite printing, shipping, and delivery as major blind spots .
2. Surprise Costs and Missed Windows
82% of teams have faced unexpected costs or missed delivery windows .
3. USPS Tracking Struggles
84% of leaders struggle to track USPS changes or anticipate what’s coming next .
4. Clear Ownership Matters
Only 39% of marketing leaders report complete, real-time visibility into delivery status .
5. USPS Changes Disrupt Planning
51% say USPS changes significantly disrupt campaign planning and forecasting .
6. Data Integration Gaps
Only 54% of high-ROI teams connect analytics platforms vs. 17% of lower-ROI teams .
7. Measurement Opportunities Missed
Only 22% track QR codes and just 31% capture in-store redemptions .
8. High-Performers Use More Response Signals
Top teams track multiple response signals to build a complete view of performance .
9. Operational Maturity Differentiates
High-ROI teams assign clear ownership of mail logistics and delivery operations .
10. The Maturity Phase
The focus has shifted from “does it work?” to “how is it executed?” .
Future Trends Shaping Direct Mail Response
1. Continued Response Rate Growth
Warm and cold retail response rates grew 26% and 21% year-on-year respectively .
2. Global Market Value: $70 Billion
Direct mail is a thriving, multi-billion dollar global industry .
3. 25% of Marketing Budgets Now
Companies allocate a quarter of budgets to direct mail .
4. 9 in 10 Leaders Increasing Investment
Almost all marketing leaders are increasing their direct mail spend .
5. AI Integration Deepens
AI for personalization, attribution, and delivery accuracy separates top performers .
6. Data Integration Expands
Analytics platforms and third-party data sources connect online and offline behavior .
7. Partially Addressed Mail Inclusion
The Response Rate Tracker now includes partially addressed mail benchmarks .
8. De-Escalation of Digital Dominance
Physical mail is re-establishing itself as a premium marketing channel .
9. The “Super Touchpoint” Evolution
Mail seamlessly bridges physical and digital consumer journeys .
10. Operational Rigor Becomes Critical
Teams seeing the strongest returns apply the same rigor to logistics as to digital .
Frequently Asked Questions
What is the average response rate for direct mail in 2026?
4.4% overall, according to the ANA/DMA Response Rate Report .
How does direct mail compare to email response rates?
Direct mail’s 4.4% response rate is roughly 37x higher than email’s 0.12% .
Do house lists perform better than prospect lists?
Yes – house lists average 5-9% response rates, while cold prospect lists average 2-4.4% .
What industry has the highest direct mail response rate?
Luxury goods and services at 4.46%, followed by technology at 4.30% .
How long does direct mail stay in a home?
The average piece stays in the home for 17 days, with a median lifespan of 23 days .
What ROI does direct mail deliver?
Direct mail delivers 112-161% ROI, outperforming email’s 44% .
Does direct mail drive digital engagement?
Yes – 9.4% of mail items prompted website visits in Q1 2026, and 56% of mail-driven purchases were fulfilled online .
What increases direct mail response rates most?
List quality matters most, followed by personalization, a single clear CTA, and omnichannel follow-up .
How many times is direct mail interacted with?
The average direct mail piece is interacted with 4.5 times over a 28-day period .
Is direct mail growing or declining as a channel?
Growing – companies now dedicate 25% of budgets to direct mail, with 90% of leaders increasing investment .
Conclusion
Direct mail is no longer your grandmother’s marketing channel. In 2026, it represents a sophisticated, data-driven powerhouse delivering response rates that digital channels can only dream about. The numbers are clear: 4.4% response rates, 161% ROI, 84% open rates, and physical presence that lasts weeks instead of seconds .
The evidence suggests marketers need to reconsider direct mail as a core component of their marketing mix. With digital fatigue at an all-time high and customer acquisition costs spiraling upward, physical mail offers a tangible, trusted alternative that actually gets opened and acted upon. The key is execution – high-quality lists, meaningful personalization, clear CTAs, and strong logistics management separate winning campaigns from the rest.
Don’t let the opportunity pass by. Start testing direct mail in your marketing mix, leverage the omnichannel synergy, and watch your response rates rise. Your customers are waiting by the mailbox.
Discover More:
- National Guard Response Force: Your Complete Guide to Understanding This Critical Mission 2026
- SM7B Frequency Response: The Complete Guide to Its Legendary Sound 2026
