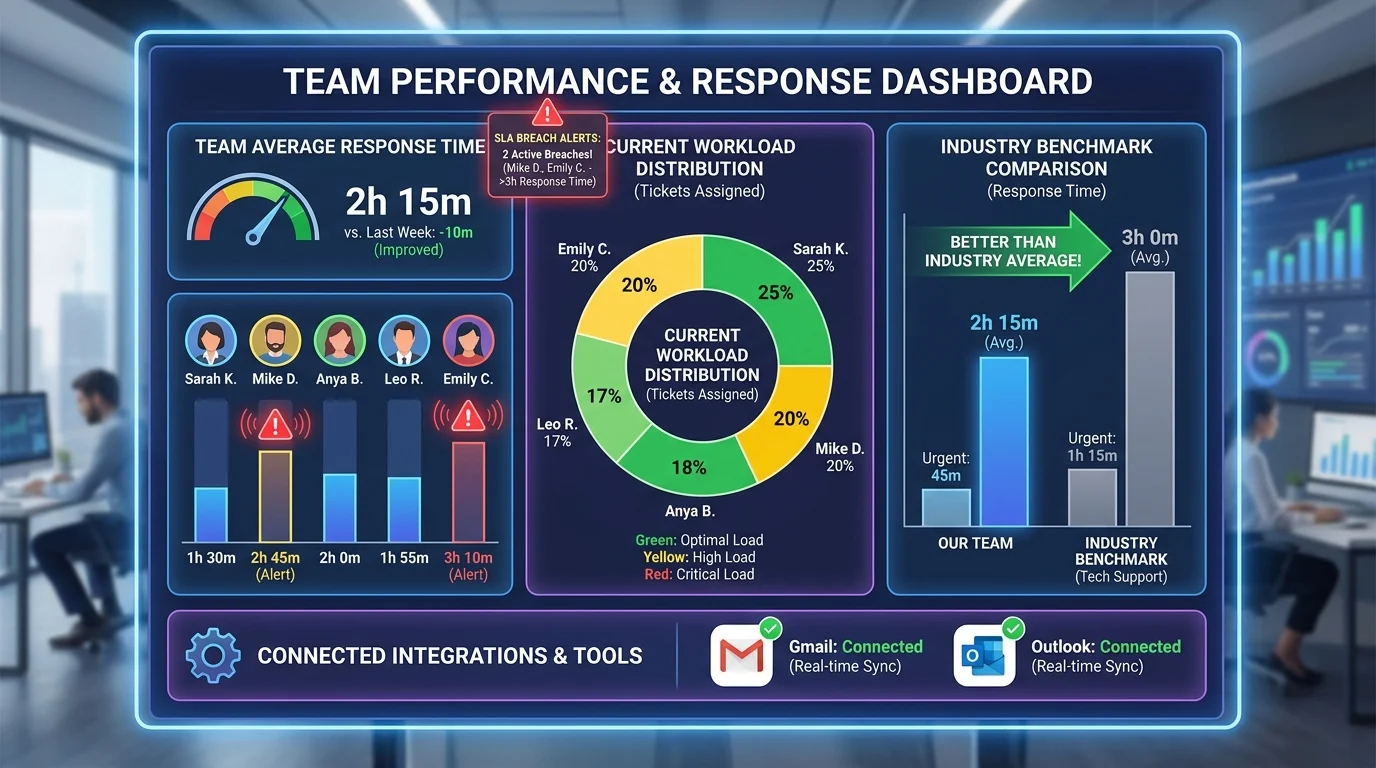
Quick Ans: Email response time tracking software monitors how quickly your team replies to customer and prospect emails. Tools like EmailAnalytics, HubSpot Sales Hub, Zendesk, and Front automatically measure response metrics, generate dashboards, and provide SLA breach alerts. Key features include per-reply time tracking, workload balancing, real-time alerts, and team comparison dashboards. Most platforms connect directly to Gmail or Outlook with no installation required.
Every email left unanswered for 24+ hours is a lead going to your competitor or a customer drafting a complaint . For email-heavy teams, slow response times cost deals, damage client relationships, and hurt your reputation.
The problem? Outlook and Gmail don’t tell you who’s slow to reply, which emails are leaking revenue, or where your SLAs are breaking . Managers are flying blind, and pulling the data manually means asking your team to track themselves – which never works.
Email response time tracking software solves this problem by turning raw message metadata into actionable KPIs you can use to coach performance and protect customer experience . These tools give operations and customer service managers a live view of team member reply times, with real-time SLA breach warnings . Nothing to install. No training necessary. No workflow changes for your team.
The average response time improvement across teams using these tools is 42.5%, with many cutting response times by 40% or more . Let’s explore exactly how these tools work and which one fits your team.
What Is Email Response Time Tracking Software?
Email response time tracking software automatically monitors how quickly your team replies to incoming messages. It turns email metadata into metrics managers use to identify bottlenecks, rebalance workloads, and hit SLA targets.
Key capabilities include:
- Average response time per person and per recipient
- Busiest hours and days for email activity
- Top senders and recipients
- Individual email drill-downs
- Daily and weekly emailed reports
- Real-time SLA breach alerts
- AI-powered sentiment scoring on every inbound and outbound message
These tools typically integrate directly with Gmail (Google Workspace) and Outlook (MS365) with no software installation required . You connect your team’s inboxes, and the dashboard populates automatically.
How Email Response Time Tracking Software Works
1. Direct Integration with Email Providers
The software connects securely to Gmail, Outlook, or other providers via APIs, pulling only header metadata rather than message content .
2. Real-Time Data Collection
Every email sent and received generates timestamps, sender/recipient information, and thread details .
3. Response Time Calculation
The system automatically calculates the time between receiving a message and sending the first reply, per recipient, per agent, and across the team .
4. Dashboard Visualization
Analytics display in team dashboards showing average response times, SLA adherence, workload distribution, and trends .
5. SLA Breach Alerts
When emails go unanswered past your threshold, the system sends real-time warnings to managers .
6. Sentiment Scoring
AI-powered scoring on every inbound and outbound message helps detect at-risk customers before they complain .
7. Workload Balancing Insights
Team comparison dashboards reveal which reps are overloaded, allowing managers to redistribute work fairly .
Top Email Response Time Tracking Tools in 2026
1. EmailAnalytics
Best for: Mid-sized teams needing response time visibility without workflow changes.
Used by 10,000+ teams, EmailAnalytics gives managers a live view of team member reply times with real-time SLA breach warnings . It connects to Gmail and Outlook with nothing to install and no retraining required .
Key Features:
- Team comparison dashboard with average response time per person
- Real-time SLA alerts for unanswered emails
- AI-powered sentiment scoring
- Workload balancing insights
- Daily and weekly emailed reports
Pricing: $19 per inbox, 14-day free trial
What Users Say:
“It’s one of the most important tools we use… It enabled us to make data-driven decisions and present clients with real data, which they love.” – Matthew Hellrung, Co-founder and Partner, Meltzer Hellrung
2. HubSpot Sales Hub
Best for: Teams already using HubSpot CRM who want email tracking integrated with customer data.
HubSpot Sales Hub logs opens, clicks, and replies directly to contact timelines alongside deal stages, calls, and website visits . This context helps sales teams prioritize follow-ups based on engagement signals.
Key Features:
- CRM-linked email activity logging
- Automated sequences and email templates
- Forecasting based on deal probability
- Prospecting Agent for research and outreach drafting
Pricing: Starts at $7/seat/month (Starter), $90/seat/month (Professional)
3. Zendesk
Best for: Customer support teams managing high email volume with ticketing workflows.
Zendesk converts all incoming customer emails into tickets with auto-assignment based on rules and workload . It tracks first response time and SLA adherence with detailed reporting.
Key Features:
- Macro replies for repetitive questions
- Omnichannel routing across email, chat, and phone
- Intelligent Triage with AI for intent and sentiment detection
- Agent Copilot for real-time suggestions
Pricing: Starts at $55/user/month (Suite Team)
4. Front
Best for: Teams wanting a shared inbox with chat-like collaboration and response tracking.
Front combines the interface of an inbox with collaboration features, allowing teams to assign emails as tasks and measure individual performance .
Key Features:
- Email assignment and workflow customization
- Shared templates with placeholders
- SLA tracking by channel or team
- AI Compose for drafting responses
Pricing: Starts at $19/seat/month
5. Boomerang
Best for: Individuals and small teams needing follow-up automation and reply prediction.
Boomerang lets you flag threads and set reply deadlines; it automatically sends follow-ups if recipients stay silent . Its Respondable feature scores drafts based on reply likelihood.
Key Features:
- Follow-up automation with cancellation upon reply
- Respondable draft scoring
- Inbox Pause to control incoming email flow
- Email scheduling and recurring messages
Pricing: Starts at $4.98/month, Pro at $14.98/month
6. HubSpot’s Free Tracking
Best for: Small teams wanting basic email engagement tracking.
The free plan logs opens and clicks with real-time alerts, and integrates with the CRM . It’s lightweight and doesn’t require an upfront cost.
Key Features:
- Real-time open and click alerts
- Auto-logging to contact timelines
- Data-driven personalization
Pricing: Free; paid plans start at $15/seat/month
Key Metrics to Track
Average Response Time
The most common metric – average minutes or hours to reply to a new email. Industry benchmarks vary from 3h 14m (fastest) to 6h 5m (slowest) .
First-Touch Time
Median time across the inbound queue from receipt to first reply, tied to SLA adherence .
SLA Adherence Percentage
Percentage of emails replied to within the agreed SLA threshold. Example: “≤ 4 hours” .
Median Response Time
Better than average when outliers exist. Example: 5 tickets with times [1, 3, 4, 5, 90] minutes yield an average of 20.6 but a median of 4 – which better represents typical performance .
Workload Metrics
Emails sent and received per rep, grouped by role .
Balance Metrics
Top senders and recipients revealing over-reliance on one rep or hidden account dependencies .
Domain Performance
Response efficiency and SLA compliance by customer domain (@gmail.com, @partnercompany.com, etc.) .
Close Time
Time from message receipt to resolution, measured in user time (when assigned), mailbox time (open hours only), or elapsed time (24/7) .
Industry Benchmark Data (Q1 2026)
Fastest Industries (work-hours response time):
- Association & Property Management: 3h 14m
- Marketing: 3h 33m
- Real Estate: 3h 36m
- Industrial Repair: 3h 37m
- Manufacturing: 3h 42m
- Sales & Marketing: 3h 44m
Slowest Industries:
- Wholesale Construction Products: 6h 5m
- Security: 5h 31m
- Communications: 5h 12m
- Logistics & Transportation: 5h 12m
- Education: 5h 1m
Note: Work-hours response time represents response time during the mailbox’s operating hours, while “actual” time includes after-hours and weekends. For example, a 3h 14m work-hours response often translates to 10h 57m actual elapsed time .
Build vs. Buy Decision Framework
| Factor | Build In-House | Buy a Platform |
|---|---|---|
| Time to first dashboard | One to two engineering quarters | A few business days |
| Ongoing maintenance | API changes, OAuth refreshes, hosting | Handled by vendor |
| Customization ceiling | Very high, anything is possible | Bounded by vendor roadmap |
| Total cost of ownership | Engineer salary plus infrastructure | Per-seat subscription |
| Risk of abandonment | High when original engineer leaves | Low, vendor keeps the lights on |
| Best fit | Teams with rare requirements and spare engineers | Teams that need value this quarter |
For most B2B teams under 200 people, buying wins on every axis .
Rollout Playbook: 10 to 100 People
Phase One: Pilot
5 to 10 reps over four weeks. Goal: prove data is trustworthy and managers will actually open the dashboard .
Phase Two: Expand
Full pod or department (20-40 people). Goal: make weekly ops review depend on the dashboard – it stops being optional .
Phase Three: Standardize
Across the company. Written SLAs, agreed-upon metric definitions, a permissions model, and a “what we won’t measure” document .
Phase Four: Embed
Dashboards feed into onboarding, performance reviews, and capacity planning. Removing the system becomes more painful than maintaining it .
Critical Success Factor:
Name an internal owner before you sign any contract. Email analytics programs without a single owner die in phase two, every time .
Common Pitfalls When Scaling
1. Treating It as a Tool Purchase Instead of a Management Practice
The dashboard is the easy part. The weekly habit is the hard part .
2. Measuring Everything
More metrics dilute attention. A team chasing 15 numbers usually moves none of them .
3. Skipping the Rep-Facing View
If reps can’t see their own performance data, they can’t improve it.
4. Privacy Blind Spots
Some metrics would feel awkward read aloud at an all-hands. Those belong in the individual column, not the team dashboard .
5. Ignoring Outliers
Average response time can be misleading. Check median, workload balance, and SLA breach counts separately .
Frequently Asked Questions
What is email response time tracking software?
It’s software that automatically monitors how quickly your team replies to emails, providing dashboards, alerts, and reports to identify bottlenecks and improve performance.
How does email response time tracking work?
The software connects to your email provider (Gmail, Outlook, etc.) via APIs, pulls timestamp metadata from sent and received messages, and calculates response times per recipient, per agent, and across the team.
What’s a good email response time?
Industry benchmarks range from 3h 14m (fastest) to 6h 5m (slowest) for work-hours response. Professional services (law, consulting) average 4h 2m. Software and technology average 4h 8m .
Is average or median response time better?
Median is often better than average because it’s less distorted by outliers. For example, if one ticket takes 90 minutes but most take 1-5 minutes, the median better represents typical performance .
Do I need a separate tool or can I use Outlook/Gmail built-in features?
Outlook and Gmail don’t provide team dashboards, SLA breach alerts, or aggregate performance metrics. Specialized tools are needed for visibility at scale.
Can response time tracking work without installing software on team members’ computers?
Yes. Most tools connect to email providers via APIs with no installation required .
What’s the average improvement after implementing these tools?
Teams typically see 30-50% improvement. EmailAnalytics reports a 42.5% average improvement across their customer base .
How do I choose between EmailAnalytics, Zendesk, and Front?
- EmailAnalytics: Best for response-time visibility without changing workflows
- Zendesk: Best for support ticketing and multi-channel
- Front: Best for shared inbox with team collaboration
Does tracking response times feel like micromanaging?
Not if implemented correctly. The best tools provide data for coaching, not surveillance. Teams with optional employee-level visibility settings and daily summary reports for leaders avoid micromanagement .
Conclusion
Email response time tracking software transforms how managers lead email-heavy teams. Instead of guessing who’s slow to reply, you get data-driven visibility into every inbox .
The right tool doesn’t require workflow changes or retraining . It simply shows you where time is going, who needs help, and which emails are leaking revenue. The 42.5% average improvement across teams using these platforms proves that what gets measured gets managed.
Start small. Pilot with 5-10 reps for four weeks . Prove the data is trustworthy and that managers will actually open the dashboard. Expand from there. And remember: the tool is the easy part. The weekly habit of reviewing and acting on the data is what moves the needle.
Discover More:
- 200+ IVR Interactive Voice Response Scripts for Every Business Scenario in 2026
- Threat Hunting vs Incident Response: 7 Key Differences and How They Work Together for Cyber Resilience 2026

1 thought on “Email Response Time Tracking Software: A Complete Guide to Measuring and Improving Team Performance 2026”